This is Lukas Bergstrom's personal weblog. You might want to visit my professional site. You can also find me on Twitter, Bluesky, and LinkedIn.
Visualize higher-dimensional data

omg the web is alive

Visual CSV Fingerprint

Slick dataviz at Strava
Strava is a tool I use to track my bike rides: mileage, route, speed. I record rides with GPS, upload them to Strava, comment on friends' rides - cycling is already addictive, Strava makes it more so. And I love the way they visualize your rides for the year to date.

A calendar view of bike rides

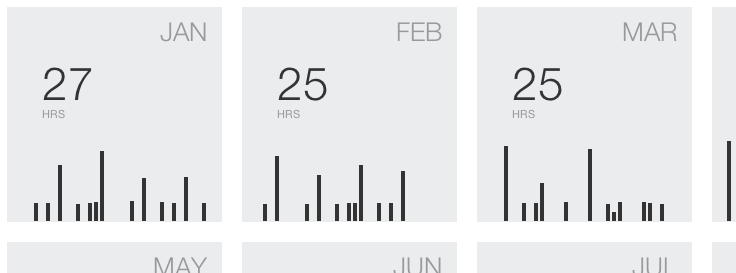
Each black bar is a ride, the height corresponds to the mileage for the ride.

I will figure out the need later
I want to create a timeline with Timeline by Verite.

Agriculture: not sexy, but important. Gapminder is a sweet data-visualization tool with some fascinating pre-loaded datasets, makes it easy to compare variables over time and between countries. But, dude, there is no way that Jordan harvests 23,333 kg of maize per hectare..

Yeah. No way.

The most common tool used by (corporate and government) decision-makers to show structured arguments is, of course, PowerPoint. And because no single "argument template" is appropriate, you'd be hard-pressed to find a better one.

see also Ninja Tools for Meetings

From New York's School of Visual Arts. Don't have any of these books, but want them all. (That's right: I don't own a single Tufte book.)

Yet Another List of Stuff. Lots of pretty pictures though, which are obviously useful here. (via MeFi)

Enter data, generate charts, use wherever. Neat model: mark the data you enter as freely available, the service is free. Keep it private, you pay.

Gorgeous design. Dude goes to a lot of bars. I've been down on these annual summaries recently, they often come across as narcissistic, or as bragging. But reflecting is good, and this report is just too damn pretty to be mad at.

Only normally, putting things in perspective doesn't make you shake with rage

Don't stare at it too long, you'll get time-vertigo.

Spectacular overview, history, and resources/tools list for treemaps (a method of visualizing tree structures that can convey information beyond just hierarchy, such as size, proximity etc.)

Visualizations of complex networks.

Embryonic version of automatic graph generator for Windows based on the kickass Graphviz from AT&T Research.

Blog on data visualization and data visualization art.

When you click past the intro page, prepare for a giant Java app to load.

Karl Hartig: Data Visualization
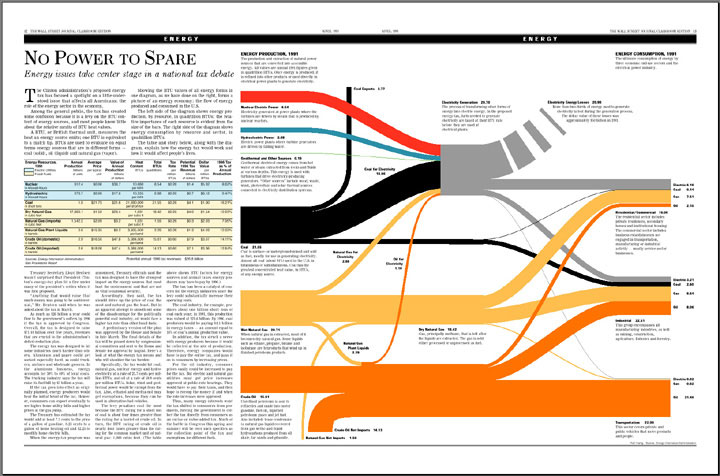
Some really tremendous charts from a WSJ designer. I hestitate to use the word inspirational for anything that ends up in a Powerpoint deck, but yeah, it is.

Tech
Wearables, Javascript, Shopping, Social, Visual, Net, OS, Web, Storage, Web analytics, Product Management, Security, RSS, Android, Automobile, Business, Energy, PIM, Collaboration, barcamp, Medical, Open, a11y, Audio, AI, Development, Hardware, s60, Crowdsourcing, Mobile, WRX, MacOS, Data

Other
CrowdFlower, Activism, NYC, Berlin, Friday, California, Surfing, Feminism, Clothes, Toys, Quizzes, Minnesota, Housing, Food & Drink, Travel, History, Geography, Sports, Life hacks, Transportation, Statistics, Video, Law, Podcasts, Politik, Boston, L.A., Bicycling, San Francisco, Personal care, Games, Agriculture

Music
Reviews, Mixes, Booking, Good tracks, Videos, Labels, Making, Hip-hop, Boston, House, Lyrics, Business, History, Mp3s, Events, L.A., Musicians, Streams, Mailing lists, Shopping

People
MOTAS, Journaling, Exercise, Friends, Gossip, Me, Weblogs, Health, Working with, ADD, Meditation, Life hacks, Enemies, Family, Subcultures, Stories, Heroes, Languages, Buddhism, Vocations

Arts
Events, Humor, Literature, Burning Man, Spoken Word, Visual, Animation, Desktop wallpaper bait, Poetry, Sculpture, Movies, Rhetoric, Outlets, Comix, iPad bait

Commerce
Insurance, Shopping, Web, IP Law, Management consulting, Macroeconomics, Real Estate, Investing, Taxes, Marketing and CRM, Personal finance, Personal services, International Development, Non-profit, Microfinance

Design
Presentations, Web, Furniture, Cool, Data visualization, Tools, Architecture, Algorithmic, Type, Process, User experience, IA

Science
Zoology, Networks, Environment, Physics, Psychology, Cognition, Statistics and Data

Travel
Kingdom of Siam, Vagabond '08, Kenya, Uganda

Photos
Moblog, Friends, Photos I Wish I'd Taken

Philosophy
Mind

One Acre Fund

Internet classic

Mathematics

Subscribe to this site's rss feed

I'm also on Mastodon